Interactive tool tracks the declining affordability of New York City

Phoo via CC0 License
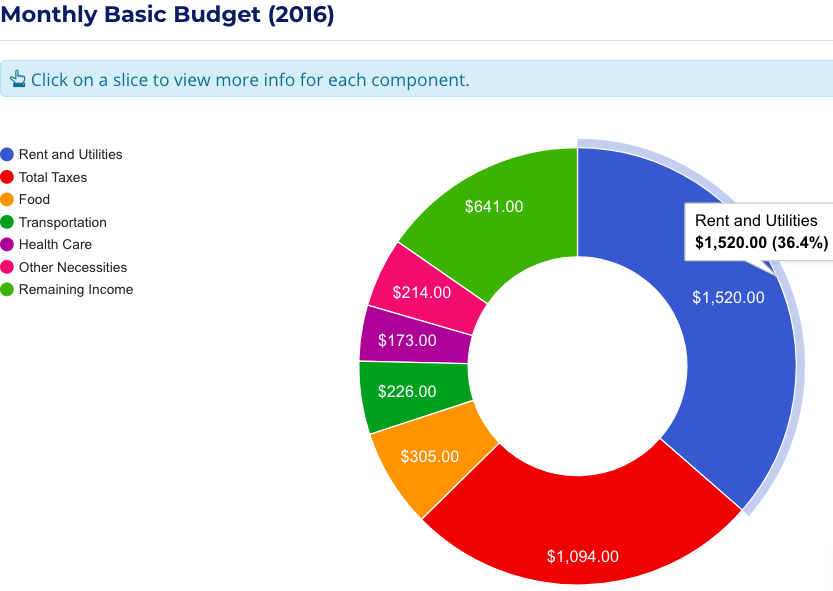
Between 2005 and 2016, the cost of basic needs like housing, transit, food and healthcare has grown at twice the rate of incomes in New York City, according to a new report released by City Comptroller Scott Stringer on Monday. Stringer’s office created a first-of-its-kind Affordability Index to track how much money New Yorkers have left over after taxes and basic expenses. The numbers are not comforting. The report found that single adults living in NYC had just $641 leftover after taxes and basic expenses in 2016, compared to $831 a decade ago.
“Over the last decade, the money that New Yorkers could be putting away – for retirement, for college, or even for a simple family night out – has been shrinking,” Stringer said in a press release. “Our growing affordability crisis is making it harder for families to enjoy a basic middle-class lifestyle – and is forcing them to choose between staying in New York City and leaving.”

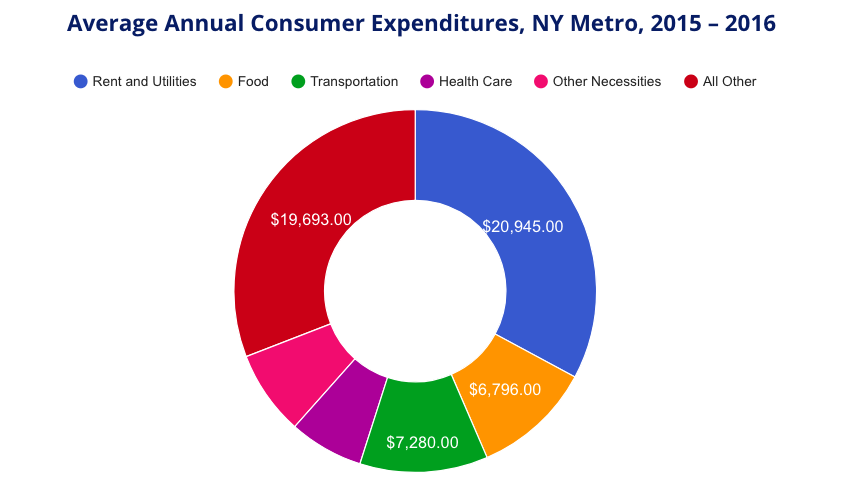
The comptroller’s Affordability Index calculates a basic budget for four household types based on middle income for the year 2016. According to the report, basic expenses including rent and utilities, food, transportation, health care, child care and other necessities like clothing and household products, made up about 70 percent of average household spending in the New York Metro area.
Stringer found single parents with two children have the hardest time affording basic necessities in NYC. Since 2005, single adults with children saw basic expenses rise by over $1,200 each month, outpacing income growth by over 40 percent.
Household incomes increased by just 2.7 percent per year for a single parent with two children, 1.8 percent for a single adult, 2.9 percent for a married couple and 3.3 percent for a married couple with two children. The rate of median rents has soared on average by 4 percent per year, a jump of nearly 50 percent since 2005.
The index will be updated annually to monitor the economic distress felt by these four typical household types. Explore the index here.
RELATED:
Get Insider Updates with Our Newsletter!
Oops! We could not locate your form.